Did We Really Save Money?
A lower cost per package is a question, not yet a saving. Trace physical work, released capacity, and the benefit that reaches the business.

The dashboard says cost per package has fallen. The trucks, shifts, and total bill appear unchanged. Has the operation improved, has the mix changed, or has a different allocation moved cost elsewhere?
Those are different explanations with different implications. Before accepting a savings claim, follow the physical change into a financial consequence and identify whose costs, which population, and what period the comparison covers.
Three cost views
Marginal cost asks what resource expense changes because of this decision, over the chosen horizon. Opportunity cost asks which alternative use is sacrificed. Allocated cost attributes a total to products, orders, teams, or regions under a declared policy.
A paid truck with ten empty compatible positions may accept another parcel for $0.20 in handling and no additional truck payment. The same parcel can still consume a valuable slot. Its allocated share of the truck bill may be much larger. These statements can all be true.
Over a quarter, enough reduced volume might remove a recurring departure. A short-run zero cash effect does not prove zero long-run value, and released capacity does not prove a bill has already disappeared.
Reconcile the book shipment
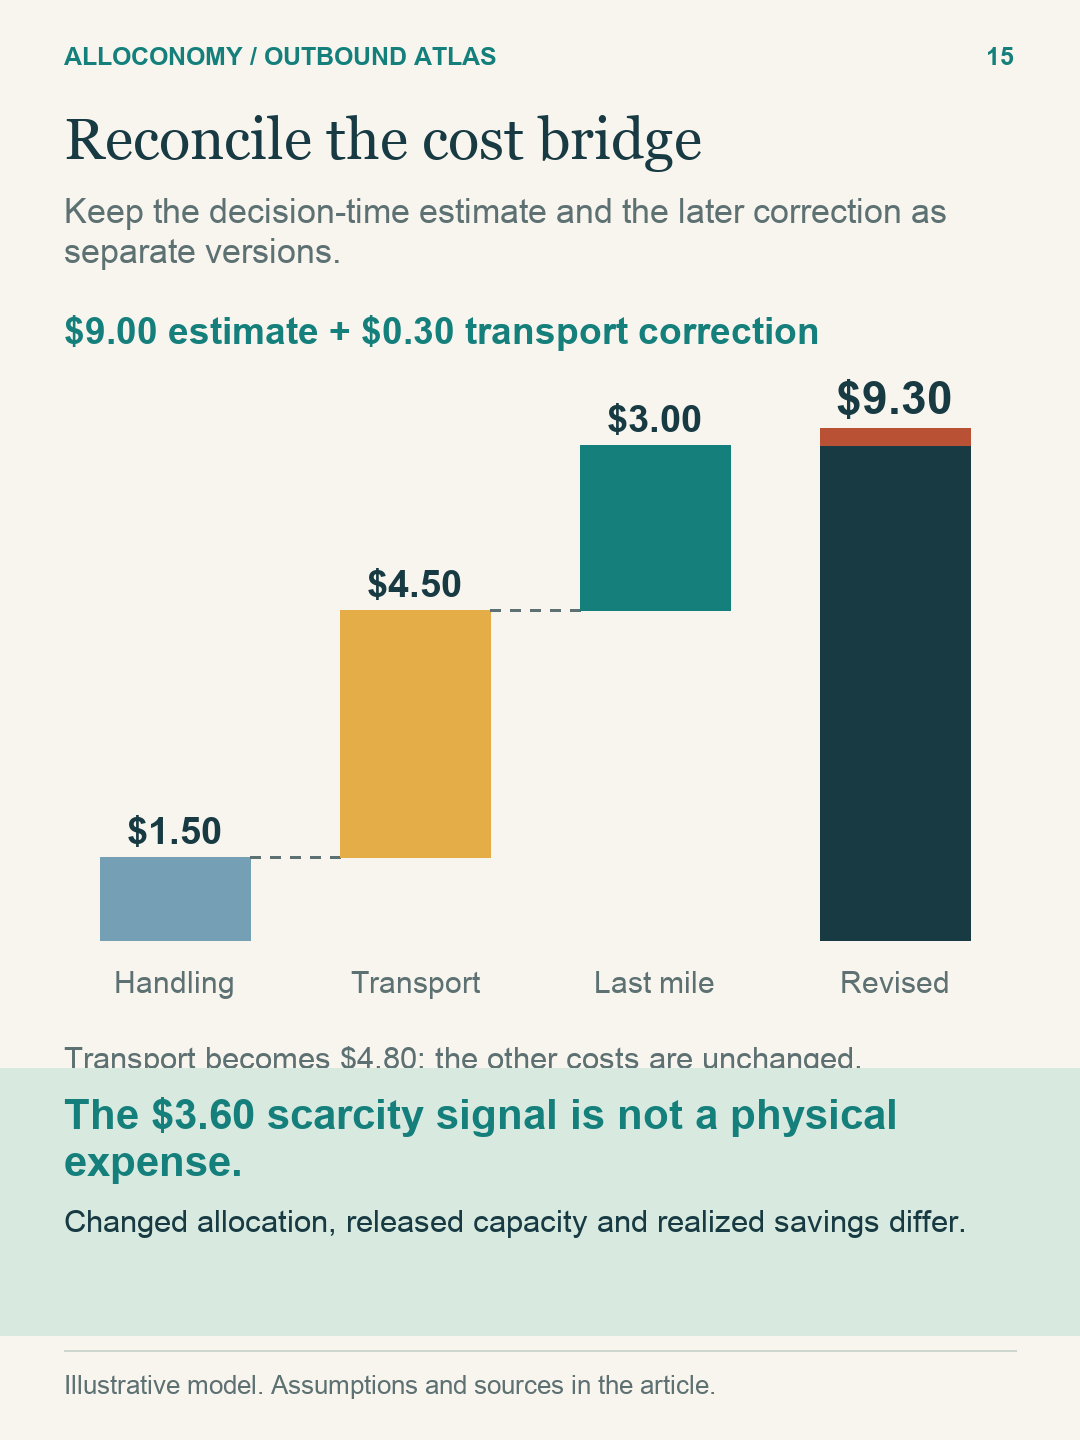
Return to the $9 combined recovery shipment. Suppose its estimate contains $1.50 of warehouse handling, $4.50 of transport, and $3.00 of incremental last-mile expense. The sum is $9.
An equal allocation across the book and workbook assigns $4.50 to each. A different reasonable attribution could differ, but the total must still be $9. The $3.60 inventory opportunity value from Part 10 does not become another physical expense.
If the transport invoice later becomes $4.80, publish a revised $9.30 total and explain the $0.30 difference. Keep the earlier estimate, its date, and what the decision maker knew. Correction should improve the record without erasing history.
View the full-size diagram →
A benefits bridge needs each link
To substantiate savings, follow work reduced → capacity released → capacity removed or productively reused → economic benefit realized, then subtract implementation and transition costs and state timing.
Capacity reused for growth can be valuable without lowering current expense. A team transferring allocated cost to another team creates no network saving. A packaging change that reduces cube but leaves the same trucks and shifts may have option value before it produces cash savings.
Each link requires evidence. Physical events, carrier invoices, labor commitments, and accounting totals answer different questions. Matching two reports does not prove completeness if both omit the same shipments. Use an independently established activity population where possible, and reconcile unmatched and late-arriving records explicitly.
Fix the metric before comparing it
| Metric | Boundary to specify | Misleading shortcut |
|---|---|---|
| On-time delivery | Original accepted deadline, eligible commitments, failure treatment | Rewrite dates and call service better |
| Cost per item/order/package | Same cost scope and distinct population | Compare unlike denominators |
| Truck utilization | Cube or weight, usable capacity, included departures | Fill trucks while missing cutoffs |
| Warehouse productivity | Work mix, quality, paid or productive hours | Move waiting to packing |
| Delivery density | Stops, packages, miles, external-channel volume | Outsource difficult stops and omit their cost |
A faster service can attract smaller baskets. Cost per order may rise while the underlying operation improves. A slower service can improve punctuality. The metric needs context before it supports a business conclusion.
Before and after is not automatically because of
Seasonality, fuel, wages, demand mix, new facilities, and service changes can explain observed movement. Orders also share stock and capacity: one treated order can affect the outcome of an untreated order. That makes a naive order-level experiment vulnerable to interference.
Public research on network experiments discusses this general problem. S14 In a fulfillment setting, geographic clusters or time-block comparisons may help, but shared hubs and inventory carryover still need treatment. A simulation supplies a modeled counterfactual; it does not independently establish realized causal savings.
What changes for the reader
Maya should compare fees with complete service and inventory obligations. The network leader should publish a metric dictionary, versioned estimates, and a benefits bridge. An investor should ask whether improvements reach cash generation after capital, operating, and transition costs, and whether they persist under a changed mix.
Try the idea: a new allocation method lowers one region's cost by $1 million and raises another's by $1 million. Unless physical activity or external cash flows also change, the network has saved nothing. Better attribution may still be useful; call it better attribution.
Public sources and evidence boundaries
The calculations and operating scenes above are fictional teaching models. These public references support the limited background claims identified in the text. Checked 18 October 2026.
- S14: Design and analysis of experiments in networks: Reducing bias from interference (2014-04-29). Primary research on network interference. Application to fulfillment is expressly editorial analysis.
Previous: The Journey Back: Returns, Safety, and Resilience · Next: Follow the Book Home: A Leader’s Review · Return to the opening guide