Advertising Alloconomy, Part 1: Who Gets the Advertising Dollar?
Alloconomy brings allocations and economy together. Follow the advertising dollar, examine who earns it, and ask what value each allocation creates. Read this introduction first; it stands on its own.
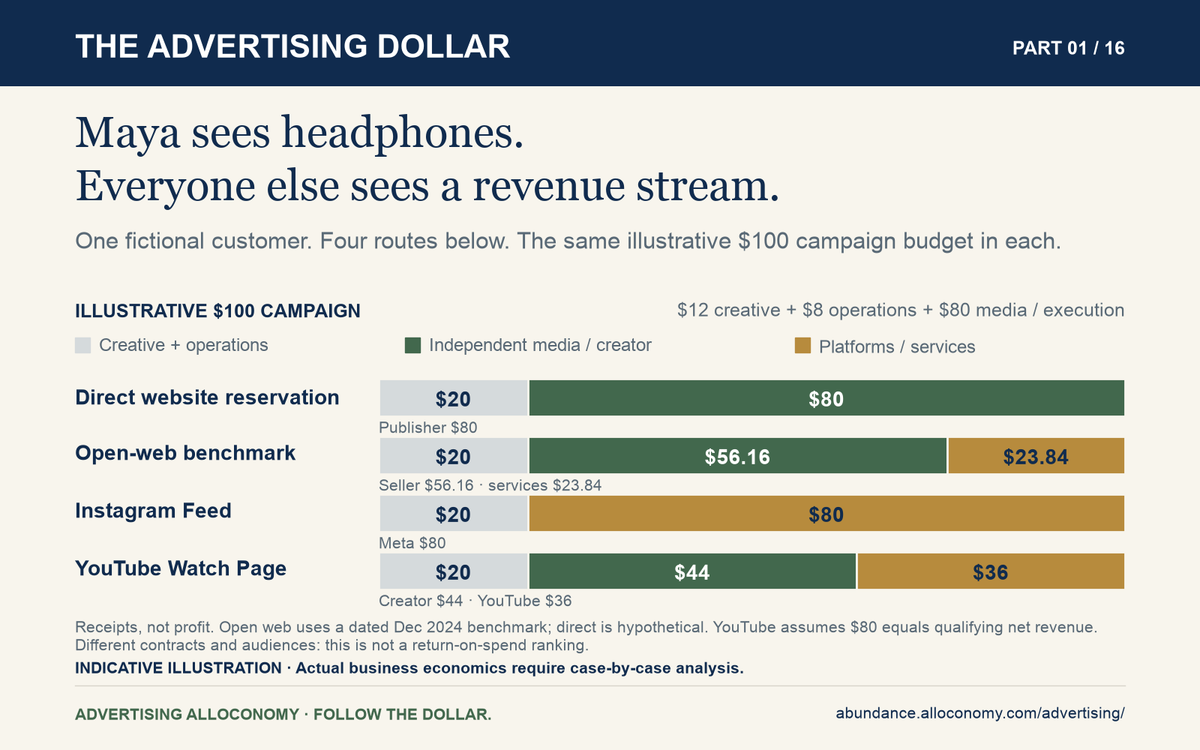
Alloconomy brings allocations and economy together. Its central question is how resources are assigned, who receives them, and what value those choices create. Advertising makes that question concrete: a business allocates money to reach an audience, and an economy of creators, agencies, technology providers, and media owners forms around that decision. This series puts those allocations at the center. Every fee and receipt is a claim on the same finite budget; understanding the economy means examining what each claim contributes.
Northstar Audio has headphones to sell. Maya is reading the news. Between a company wanting a customer and a person encountering an advertisement sits an industry that creates messages, assembles audiences, allocates attention, delivers media, moves money, and measures results.
Suppose Northstar spends $100. Who receives it? What does each recipient do to earn it? And if a recipient disappeared, would the system become cheaper—or would someone else have to take over an essential job?
Those questions give us a useful map of digital advertising. They also give us a way to judge its businesses. A fee can pay for valuable work. It can also reflect bargaining power, restricted access, opaque pricing, or a service that another participant already performs.
The central distinction is between a function and a company. An advertiser needs some way to select and deliver an ad; it does not always need a separate business for each function. Google, Amazon, and Meta perform several jobs within their own systems. On the open internet, those jobs are often distributed across companies.
Here is one concrete allocation to keep in mind. Follow the ribbons from the advertiser’s $100 to the businesses receiving it; wider ribbons represent larger amounts. The later essays show how the shape changes across buying routes.
Follow the dollar
Where a $100 campaign budget goes
One illustrative open-web campaign · USD · $12 creative + $8 operations + $80 execution.
Each ribbon ends at a recipient or disclosed bundle. Widths show final allocations, not the order of payments.
Exact amounts and accessible table
| Recipient | USD from original $100 |
|---|---|
| Creative | $12.00 |
| Campaign operations | $8.00 |
| DSP core fee | $6.88 |
| Additional buy-side costs | $6.56 |
| SSP / exchange cost | $10.40 |
| Seller receipts | $56.16 |
| Total | $100.00 |
Total external campaign expense$100.00
Creative and operations are teaching assumptions. The remaining $80 uses the ANA December 2024 benchmark: 8.6% DSP, 8.2% additional buy-side costs, 13% SSP, and 70.2% seller receipts. This is a dated sample, not a universal fee schedule. Receipts precede the seller’s own costs.
Before following individual ads through the later essays, we will learn the cast, follow the dollar, and apply one recurring test: what value does this participant add, and what must replace that value if it is removed? Northstar and Maya are fictional; company examples and disclosed figures are sourced. The removal tests are economic analysis, not measured claims about a specific vendor.
Why this matters to you
Knowing who receives the advertising dollar is useful when it changes what you trust, what you buy, what you build, or what you are willing to pay for a business. The diagram is a way to make those decisions with fewer mistaken assumptions. The same transaction looks different from each seat.
If you are Maya
Decide what deserves your attention.
Maya can find a useful product through an ad. But a paid position is evidence that someone bought an opportunity to influence her, not independent evidence that these are the best headphones. She can notice the sponsorship, compare alternatives against her own needs, and decide whether the offered content, service, or game reward is worth the interruption. Repeated appearances are also a reason to pause: familiarity alone does not establish quality, and the same ad appearing elsewhere does not reveal exactly which information was used. Understanding the business makes the choice more deliberate without requiring her to reconstruct an auction before every purchase.
If you work for the advertiser
Turn a budget review into a test of value.
An employee at Northstar can ask what each supplier delivers, what the charge is based on, and what evidence would justify renewing it. A low media price can still buy poor exposure; a larger fee can be worthwhile if it creates better outcomes or saves enough work. Separate the invoice check from the effectiveness check: first establish what was purchased and paid, then estimate what changed because of it. Compare alternatives after including internal labor, tools, and lost access. This gives marketing, procurement, finance, and engineering a common question: what would improve if we allocated the next dollar differently?
If you work in a business earning the ad dollar
Build something the customer would miss.
For an employee or leader in an agency, buying platform, exchange, publisher, or creator business, the allocation reveals whose problem funds the job. Name the paying customer, the capability they need, and the credible alternative they could choose. Then connect a team metric to that customer's result: fewer missed opportunities, reliable settlement, distinctive content, less operating effort, or better evidence. A fee is easier to defend when the customer can see what deteriorates without the service. A publisher or creator must also protect the experience that keeps the audience returning; extracting more from today's visit can undermine tomorrow's opportunity.
If you are an investor
Understand the earnings before valuing the story.
An investor can distinguish a company moving money from a company earning it. Start with who pays, which amounts are owed onward, how revenue is recognized, and which costs remain before profit and cash generation. Then ask why the customer stays: distinctive audience access, valuable rights, useful technology, operating integration, or simply a contract that could change. The allocation helps identify what to investigate in filings and customer economics. It does not establish a fair share price: durability, growth, reinvestment, risk, and the price paid for the investment still matter.
Use every later essay to make one decision concrete. Write down the choice, the evidence you have, and the missing fact that could reverse it. Maya might compare a sponsored product with an independent alternative. Northstar might test a buying route. A supplier might change its product priorities. An investor might revise a margin assumption. That is the purpose of Advertising Alloconomy: better choices about attention, budgets, work, and capital.
Background: FTC: recognizing advertising presented alongside content; SEC: reading financial statements and their notes. The decisions above are applications of the transaction model, not measured results for these fictional participants.
Start with the two sides that make the market possible
The advertiser funds the campaign. It wants an outcome: awareness, a store visit, a subscription, a download, or profitable sales. Familiar advertisers include consumer brands, retailers, software companies, and game developers. They are the source of the advertising dollar, so asking what intermediary “cut” they receive reverses their role.
The audience supplies attention and the possibility of a response. People are participants with preferences and agency, not inventory owned by an advertising company. They may receive content, services, or an in-game reward in exchange for an experience containing ads. They ordinarily receive no direct share of the advertiser’s payment.
The publisher or media owner controls a surface on which an advertisement can appear. A publisher can be a newspaper, app developer, streaming service, retailer, or social platform. “Inventory” means eligible advertising opportunities: a rectangle on a page, a sponsored search position, a video break, or a device home-screen placement. The rights to sell a particular opportunity can belong to a different party from the owner of the device or content.
Remove the advertiser’s demand and this market has no funding. Remove the audience’s attention and there is nothing commercially useful to reach. Remove the publisher’s experience and the placement must move somewhere else. These are the market’s foundations; the other roles help connect them.
Advertising Alloconomy · The overall map
The advertising system
One budget can reach an audience through very different arrangements. Follow four simplified routes, then open a tour for the detail.
Read from the advertiser toward the audience. Connections show roles in the chosen route, not cash transfers or request timing.
Open-web auction
Separate buying and selling systems
Direct reservation
A promise made before the visit
Explore: Part 3
Integrated platform
Several jobs inside one business
Content and partner rights
Separate the ad sale from the content rights
Count the functions before counting the companies.
These families overlap: a creator placement can be sold directly or through an auction, and an integrated platform can also buy outside media. The branches organize the series; they are not mutually exclusive market segments.
Simplified teaching map. Company boundaries and contracts vary; one box does not mean one company or one fee. Dollar allocations appear in the separate money-flow diagrams. Those figures are indicative; actual business economics require case-by-case analysis.
Read the chain in three directions
An open-web buying route can look like this:
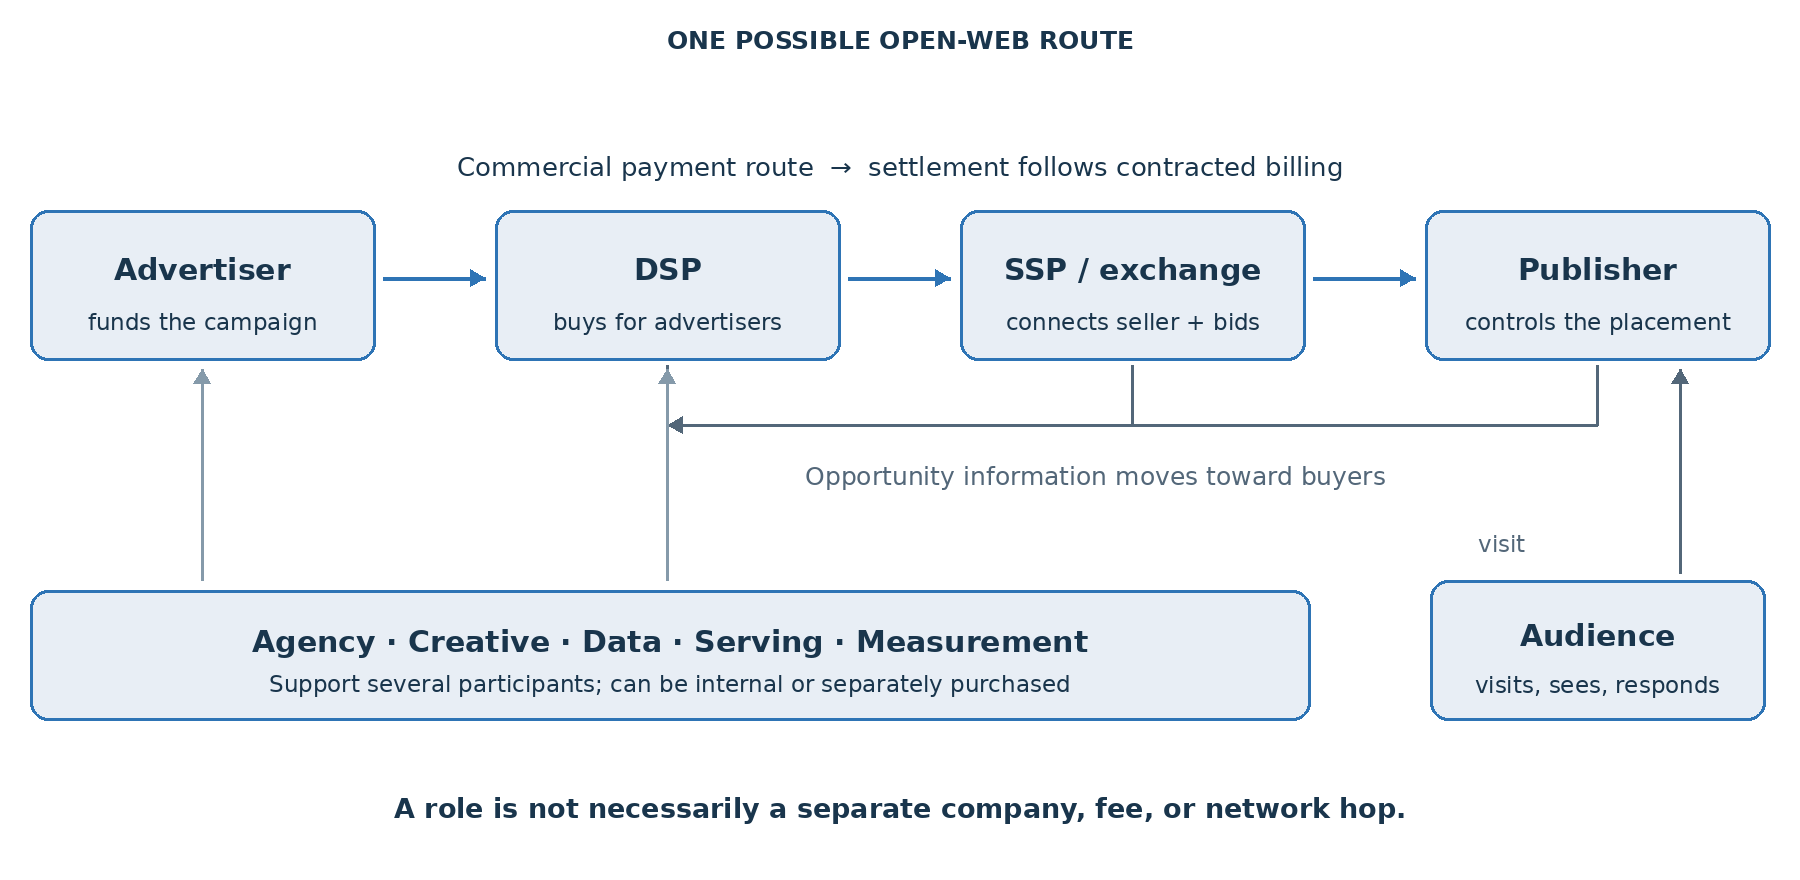
The opportunity begins with the audience and publisher. A person opens a page or app. The seller’s systems describe an eligible placement and request demand. Buying systems evaluate whether the opportunity is useful and what to bid.
The money originates with the advertiser. Commercial settlement generally runs toward the seller through the contracted intermediaries. Payment occurs later under billing terms; a bid request does not carry cash, and an auction win alone need not establish a billable impression.
The evidence comes back from several systems. Ad delivery, impressions, clicks, conversions, and fees generate records. These records must be reconciled. No single arrow guarantees that an ad was viewed by a person or caused a sale.
This diagram is one possible route. An exchange and SSP are often bundled. An agency can operate the DSP rather than sit in a separate technical hop. A publisher can sell a reservation directly. An integrated platform can perform most of the selection and selling functions internally. Real systems also contact multiple bidders in parallel; the diagram is not a literal network trace.
The cast, at a glance
| Function | What it contributes |
|---|---|
| Creative and campaign operations | A useful offer and an operating plan. |
| DSP | Decisions about which eligible opportunities to buy and how much to bid. |
| SSP / exchange and publisher serving | Demand access, transaction rules, and coordination of what can fill a placement. |
| Networks, wrappers, and mediation | Aggregation and competition among connected demand sources. |
| Data, verification, and measurement | Permitted information, quality checks, and evidence for the next decision. |
| Media owner and rights holder | The audience experience and authority to sell a particular advertising opportunity. |
The compact map is enough to follow the argument. Expand any role below for examples, payment models, and what would need to replace it.
Creative production: give the audience something worth noticing
Value added. Creative teams turn a commercial objective into the message, image, video, audio, or product presentation a person encounters. Creative technology adapts assets to formats and audiences, manages versions, and helps test alternatives. Better distribution cannot rescue an incomprehensible offer.
Without it. The advertiser must produce the material itself or use platform templates. The buying system can still function, but weak messages, incorrect formats, or slow production can waste the distribution budget. The function persists even when a separate creative vendor is unnecessary.
Examples and payment. Adobe, Canva, and Celtra illustrate creative tooling rather than three interchangeable ad-buying platforms. Production is commonly purchased as project work, staff time, or software; there is no defensible universal percentage of advertiser spend. A video’s production cost also need not rise when its media budget doubles. Adobe Express for ads, Canva’s ad maker, Celtra.
Agency and trading team: turn a budget into an operating plan
Value added. An agency can research audiences, choose channels, negotiate, configure campaigns, manage creative, and evaluate results across suppliers. A trading desk is the execution team operating buying technology; it is not necessarily another company or fee.
Without it. The advertiser can buy directly, but must internalize the expertise, tools, and operating work. For a simple campaign, a platform console may be enough. A multinational campaign spanning channels, markets, and measurement systems is a different coordination problem.
Examples and payment. Omnicom, WPP Media, Publicis Media, and dentsu. Contracts can use retainers, labor fees, media commissions, or performance arrangements. As a historical reference, the ISBA/PwC 2020 sample allocated 7% of advertiser spend to agency fees; that is neither a current rate card nor a universal norm. ISBA/PwC, May 2020, pp. 8–10.
The agency’s incentive deserves scrutiny: does it benefit when the advertiser’s outcomes improve, when spending rises, or when particular suppliers receive the budget? That question matters especially when an agency also owns data or sells media as principal.
Demand-side platform: evaluate and buy opportunities for the advertiser
Value added. A DSP receives opportunities from many supply sources and decides which campaigns are eligible, whether to bid, and how much. It coordinates budget pacing, audience rules, frequency controls where identity permits, and optimization across large numbers of possible impressions.
Without it. An advertiser must negotiate and integrate with sellers individually, build buying technology, or use a platform’s own buying console. A DSP is particularly useful when the objective spans many publishers. It is not an obligatory external supplier for a campaign buying only a platform’s own placements.
Examples. The Trade Desk, Google Display & Video 360, Amazon DSP, and Yahoo DSP. Among these examples, Google, Amazon, and Yahoo also own media businesses.
Payment. Platform fees may be percentages, with additional data, services, or management charges. The denominator varies. Amazon describes its technology fee as a percentage of media cost, with managed service separately charged; it does not publish one universal DSP percentage in that guide. Amazon Ads pricing transparency. Numerical reference points appear in the fee table below.
Supply-side platform and exchange: bring demand to the seller
Value added. The SSP helps a publisher offer inventory, connect buyers, set selling controls, manage deals, and monetize demand. The exchange performs the marketplace and auction function: receiving bids, applying transaction rules, and matching eligible demand with supply. These are distinguishable jobs, frequently performed by one service.
Without them. The publisher needs direct sales relationships, its own integrations and auction machinery, or another monetization service. Buyers lose a common way to access many sellers. A large publisher may internalize more of the work; a small publisher may depend heavily on aggregation.
Examples. Magnite, PubMatic, Index Exchange, and OpenX are useful independent supply-side examples. Google Ad Manager/AdX is also central to this category, while combining other roles.
Payment. Usually a transaction fee or share of the money reaching the selling platform, subject to the agreement. Do not deduct an “SSP fee” and then invent another “exchange fee” if one product supplies both functions. An extra reseller needs a separate value test: does it contribute distinct demand, selling rights, service, or risk-bearing—or simply another route to inventory already accessible?
Publisher ad server: coordinate the publisher’s commitments
Value added. The publisher’s ad server manages eligible placements, direct campaigns, delivery commitments, priorities, and competing demand. It is the coordinator deciding what may fill an opportunity. In Google Ad Manager, guaranteed and non-guaranteed demand can compete under delivery-aware rules; the choice is not simply “highest visible bid always wins.” Google Ad Manager: dynamic allocation.
Without it. The publisher must implement that coordination elsewhere. Otherwise campaigns can miss commitments, incompatible ads may compete, and delivery records become harder to reconcile. A small integrated monetization service can hide this function from the publisher while still performing it.
Examples and payment. Google Ad Manager, FreeWheel, Equativ, and Kevel. Fees can follow ad-serving volume, software usage, or negotiated bundles. Kevel’s SaaS model illustrates why “percentage of advertiser spend” is not always the native pricing unit. Kevel retail media.
Advertiser ad server: control delivery and maintain a campaign record
Value added. The advertiser-side ad server helps distribute approved creative, manage versions, track delivery, and maintain reporting across placements. The publisher’s server coordinates what can run on its property; the advertiser’s server coordinates the buyer’s campaign assets and records.
Without it. A buyer can rely on each platform’s native tools, but cross-platform creative changes and reconciliation become more fragmented. A separate ad server may add little for a small campaign confined to one platform.
Examples and payment. Google Campaign Manager 360, Adform Ad Server, and Innovid. Charges are generally negotiated software or serving arrangements rather than a universally disclosed share of media spend. Their products overlap with creative management and measurement; those labels do not imply three independent fees. Campaign Manager 360, Adform Ad Server, Innovid’s unified platform.
Header bidding and mobile mediation: let demand sources compete
Value added. A wrapper or mediation system coordinates several sources of demand for a publisher. Web header bidding can request competing bids before the main ad-server decision. Mobile mediation can combine bidding and sequential network offers. The coordinator is acting for supply, unlike a DSP evaluating purchases for advertisers.
Without it. A publisher may accept one provider’s monetization result or maintain the integrations itself. Fewer competitors can weaken price discovery; additional competitors, however, can also create latency and duplicated requests. More connections are useful only when their benefits exceed their costs.
Examples and payment. Prebid is free, open-source software; hosting, implementation, and managed services can still cost money. For mobile mediation, examples are Google AdMob, AppLovin MAX, and Unity LevelPlay. A software fee and the economics of affiliated advertising demand are separate questions; there is no universal “mediation cut.”
Ad network: package fragmented inventory or demand into a product
Value added. A network makes a collection of advertising opportunities easier to buy and helps publishers find advertisers. It can add targeting, creative formats, optimization, distribution, and sometimes commercial risk-bearing. A network may use exchanges internally; the advertiser may buy the packaged outcome without operating those underlying components.
Without it. Buyers and publishers need direct relationships or other buying and selling platforms. Removing a network is useful if it merely duplicates access; it can be damaging if the network supplies otherwise unavailable demand or specialized optimization.
Examples and payment. Google AdSense, Google AdMob, AppLovin, and Unity Ads illustrate network businesses, with two Google products intentionally shown as products rather than independent competitors. Economics can be a revenue share or the spread between buyer charges and publisher payouts. Google provides a concrete disclosed example later in this article.
Audience data and identity: improve the information behind a decision
Value added. Data suppliers provide useful attributes or segments; identity services help connect permitted signals across systems. They can support audience activation, frequency control, and measurement. An identifier is not certain knowledge of a person, and matching accuracy has economic consequences.
Without them. Advertising still works through context, search terms, publisher information, or first-party relationships. What becomes harder is connecting records across separate environments. The correct comparison is the improvement in decisions after paying for the data, not whether a campaign used more data.
Examples and payment. LiveRamp RampID, Epsilon COREid, and ID5. Contracts may use CPM, usage, license, or revenue-share terms. An illustrative $0.50 data CPM added to a $5 media CPM consumes 9.09% of the combined $5.50; added to $25, it consumes 1.96% of $25.50. The same service can therefore consume very different budget shares.
Verification: test whether the delivery meets minimum conditions
Value added. Verification can assess invalid traffic, viewability, brand suitability, and other delivery conditions. Pre-bid checks help avoid unsuitable purchases; post-delivery checks help identify problems. This creates evidence the buyer can compare with the seller’s own reports.
Without it. Buyers depend more heavily on supplier controls and self-reporting, or must build independent checks. They can still buy ads, but have weaker evidence about the quality of what they received. Verification itself has limits and costs; a viewable ad does not necessarily persuade anyone.
Examples and payment. DoubleVerify, Integral Ad Science, HUMAN, and Pixalate. Pricing can be usage-based, CPM, licensed, or bundled. The spend percentage depends on volume, media prices, and coverage; no defensible universal percentage is available.
Attribution and outcome measurement: decide what the evidence supports
Value added. Attribution connects advertising interactions with observed outcomes and assigns credit. Broader measurement includes reach analysis, experiments, and modeling. It helps advertisers decide what to fund next. Google Analytics explicitly describes attribution as distributing conversion credit. Google Analytics: attribution.
Without it. Advertisers may continue buying based on delivery metrics, platform reports, or intuition. They have less independent evidence for reallocating budgets. But adding attribution software alone does not establish causation: a credited purchase may have happened without the ad. Incrementality asks the harder counterfactual question.
Examples and payment. Mobile measurement providers include AppsFlyer, Adjust, Branch, and Kochava. These illustrate attribution, not four substitutes for every measurement method. Software, conversion-based, and project pricing make a universal media-spend percentage inappropriate; AppsFlyer’s pricing includes a per-conversion model.
Clean rooms: allow governed analysis across data owners
Value added. A clean room provides an environment for controlled data collaboration and analysis. It can let an advertiser investigate overlap or outcomes using its own records and a partner’s signals without ordinary unrestricted record sharing.
Without it. Some analyses become unavailable, must use aggregate reports, or need another governed method. A clean room does not create missing data, solve every privacy issue, or turn correlations into experimental evidence.
Examples and payment. Amazon Marketing Cloud, Snowflake Data Clean Rooms, and LiveRamp. Base access, compute, premium datasets, and implementation can be charged differently. This is an analytical capability, not an unavoidable toll on each impression.
Media owners, creators, and distribution platforms: supply the experience and selling rights
Value added. These businesses attract audiences, fund or distribute content, maintain the product experience, and control particular opportunities to advertise. Their revenue finances the underlying experience as well as advertising operations.
Without them. The advertiser must find a different audience relationship. Removing one seller can be easy when its inventory is substitutable; it can be costly when it offers distinctive content, customer intent, reach, or access.
Examples. For streaming content services: Netflix, Disney, NBCUniversal/Peacock, and Paramount. For device/platform advertising: Roku, Samsung Ads, LG Ad Solutions, and Amazon Fire TV.
Payment. The seller receives media proceeds and may share them with creators, content owners, distributors, or sales partners. Contractual selling rights determine the split. Owning a television platform does not establish ownership of every commercial shown inside a third-party streaming app. Publisher receipts are revenue before the publisher’s own operating and content costs, not profit.
What are the cuts? First, choose the denominator
There is no single defensible “typical cut” for every role across digital advertising. There are useful observed allocations and disclosed arrangements. The following figures give readers a scale reference while keeping unlike quantities separate.
| Role or route | Evidence-based reference | What the percentage means |
|---|---|---|
| Agency | 7% in ISBA/PwC’s 2020 sample | Share of the historical study’s advertiser-spend denominator; not a current norm. |
| DSP core fee | 8.6% in ANA’s December 2024 benchmark | Share of spend entering a DSP in that sample. |
| Buy-side data and additional costs | 8.2% in the same ANA benchmark | Additional to the core DSP bucket, on the same denominator. |
| SSP | 13.0%, derived from the ANA totals | 29.8% transaction costs minus 16.8% buy-side costs; same original denominator. |
| Seller receipts | 70.2% in the ANA benchmark | Amount after transaction costs; before the seller’s own costs. |
| Google Ads → AdSense for Content | About 68% to publisher | Current disclosed approximate publisher share for this specific route. |
| The Trade Desk, FY2025 | 21.6% revenue / gross spend | Company accounting ratio, not a pure DSP fee or industry rate. |
| YouTube watch-page partner | 55% to eligible creator | Share of defined net ad revenue; not 55% of every all-in advertiser budget. |
The programmatic figures come from the ANA Programmatic Transparency Benchmark, December 2024, pp. 4–5 and 11. The study covered April–September 2024; its waterfall excludes CTV and agency fees.
These are reference points, not endpoints of a universal pricing range. A DSP core fee, all buy-side charges, and a company’s revenue yield are different measures. Individually negotiated fees can differ materially by volume, channel, access, and service level. For creative, serving, verification, data, and analytics, convert the actual fixed or usage fee into a share of the specific campaign budget.
A more recent check is consistent with transaction costs remaining substantial: Fiducia, the ANA benchmark’s processing partner, reports 27.2% for Q2 2026. The detailed sample was not accessible in the public release reviewed here, so the fully specified 2024 benchmark is used for the teaching table. Fiducia, Q2 2026 release, August 2026.
A disclosed $100 route: Google Ads to AdSense
Google says publishers receive 80% after the buying platform’s fee; via Google Ads, they retain approximately 68% of advertiser spend. Its 2023 explanation put Google Ads’ average buying-side retention at 15%. AdSense revenue share; Google’s November 2023 explanation.
Follow the dollar
A $100 Google Ads → AdSense allocation
Media-route budget only · USD · Outside creative and agency expenses excluded.
Each ribbon ends at a recipient or disclosed bundle. Widths show final allocations, not the order of payments.
Exact amounts and accessible table
| Recipient | USD from original $100 |
|---|---|
| Google buying side | $15.00 |
| AdSense selling side | $17.00 |
| Publisher receipts | $68.00 |
| Total | $100.00 |
Spend entering the media route$100.00
Approximate disclosed mechanics: the buying side retains 15%; AdSense retains 20% of the remaining $85, or $17; $68 reaches the publisher. This illustrates average mechanics, not a transaction-level guarantee. AdSense revenue share · Google’s November 2023 explanation.
| Recipient | Amount from $100 entering this route | Share of that original $100 |
|---|---|---|
| Google buying side | $15 | 15% |
| AdSense selling side | $17: 20% of the remaining $85 | 17% |
| Publisher | $68 | 68% |
| Total | $100 | 100% |
This illustrates the average mechanics, not every transaction. The two local rates do not add to a 35% total cut: 15% + (85% × 20%) = 32%. Outside agency and production costs are absent.
Now suppose Northstar’s entire pre-tax external campaign expense is $100, with illustrative production of $12 and agency work of $8. That leaves $80 entering this route. Using the approximate split above yields $12 buying-side, $13.60 selling-side, and $54.40 publisher receipts. The five recipients total $100. The added overhead assumptions are invented for teaching, not benchmark fees.
The general conversion is simple: share of the advertiser’s total = recipient dollars ÷ total advertiser dollars. If a platform fee is instead a markup on media cost, divide the markup by media plus fee. An illustrative 10% markup on $100 of media is $10 out of $110, or 9.09% of the total.
Why “21.6% take rate” can be the wrong label
The Trade Desk reported FY2025 revenue of $2.896284 billion and gross spend of $13.394683 billion. Dividing the former by the latter gives approximately 21.6%. Its gross-spend definition includes inventory, value-added services, data, and platform fees; service mix and accounting presentation affect the revenue ratio. This is a useful company-level revenue yield, not proof that every customer pays a 21.6% DSP fee. The Trade Desk, 2025 Form 10-K, pp. 44–47.
The same discipline applies to other companies: gross billings, net revenue, gross margin, and profit are different quantities. A high gross margin is not evidence that a company retains that percentage of the advertiser’s original dollar.
Fees and ineffective spending are different losses
ANA’s 2024 benchmark separates $70.20 seller receipts from $43.90 TrueAdSpend; $26.30 was classified as media-quality loss. Deductions include invalid, unmeasurable, non-viewable, and made-for-advertising impressions. These are not another intermediary’s fee or a causal profit measure. ANA, December 2024, pp. 4–5.
A payment can reach a publisher and still buy an ineffective impression. Conversely, an unmeasurable impression is not automatically proven worthless. Reconcile the money first, assess delivery quality second, and investigate business impact third.
Why the chain changes across advertising businesses
Open internet: distributed responsibilities
The advertiser, DSP, SSP/exchange, and publisher may be separate businesses, supported by agencies, serving tools, and measurement. This creates supplier choice and specialization, alongside integration costs and opportunities for conflicting incentives. The same placement can be accessible through several routes, so multiple bid requests do not necessarily represent multiple distinct impressions.
Supply-path optimization asks which routes offer worthwhile access, price, quality, reliability, and transparency. The shortest route is not automatically best; a longer route must justify what it adds. IAB Tech Lab’s ads.txt, sellers.json, and SupplyChain specifications help identify authorized sellers and declared participants. They are transparency mechanisms, not guarantees of good value or fraud-free delivery. IAB Tech Lab, sellers.json and SupplyChain, updated January 2024.
Direct sales: fewer external trading steps, work still to do
Northstar can negotiate directly with a publisher for a sponsorship or reserved campaign. Discovery and negotiation happen through the commercial relationship. Serving, pacing, creative operations, reporting, and settlement still need owners. Programmatic guaranteed buying can automate a direct agreement while retaining platform fees.
The economic gain from a direct route depends on the fees avoided versus extra sales and operating effort, price, delivery risk, and performance. A direct sale can be efficient for a large, specific campaign; it may be cumbersome for thousands of small transactions.
Integrated platforms: several roles inside one company
On a platform’s own surface, the business can combine the audience relationship, selling rights, buying console, selection system, delivery, and measurement. Google Search, Meta feeds, Amazon shopping placements, and Walmart’s retail media illustrate versions of this model. Google Ads, Meta for Business, Amazon sponsored ads, Walmart Connect.
For a direct purchase of an owned placement, there need not be an outside publisher receiving the remainder after a small platform commission. The platform is also the media seller. External agency fees, distribution agreements, and creator payments may still apply. Treating all platform ad revenue as a pure technology “cut” would misdescribe the business; treating it as profit would be equally wrong.
Integration can reduce coordination costs and improve feedback, while concentrating control over access, prices, and evidence. Removing one external intermediary does not prove its economic function—or the platform’s bargaining power—has disappeared.
Creator and connected-TV models: follow the rights
YouTube pays eligible watch-page partners 55% of defined net advertising revenues. Shorts use a different pool-based allocation. Neither is a universal payout rule for all video advertising. YouTube partner earnings overview.
In connected TV, ask who controls the particular break, home-screen tile, or distribution inventory. Content owner, streaming service, device platform, and sales representative can be different parties. Amazon’s pricing guide, for example, describes privately negotiated inventory-share agreements with selected distribution partners. No single public percentage captures all such relationships. Amazon Ads pricing transparency.
Do not confuse the billing model with the value chain
| Billing basis | What creates the charge | What it does not establish |
|---|---|---|
| CPM | Contractually counted impressions, priced per thousand | A thousand different people or a thousand attentive views. |
| vCPM | Qualifying viewable impressions | Attention, persuasion, or incremental sales. |
| CPC | A qualifying click | A profitable customer or an incremental purchase. |
| CPV | A video view or interaction meeting the product’s rules | The same view definition across all platforms. |
| CPA / CPL / CPI | A defined action, lead, or install under a performance contract | That the conversion would not otherwise occur. |
| Reservation / sponsorship | A contracted placement, period, volume, or package | An absence of software or operating costs. |
Terminology reference: Microsoft’s advertising glossary, updated October 2025. “Cost per acquisition” can also be a calculated performance metric or optimization target on a CPM-billed campaign. Always inspect the actual charge basis.
A network could charge an advertiser per click while paying a publisher per impression; it then manages the economic risk between the two. The creative format also does not identify the billing model. Amazon documents Sponsored Products as CPC ads, including image or video and selected placements beyond Amazon. Amazon Sponsored Products.
For the later Amazon tours, DVA means Display, Video, and Audio in Amazon’s public campaign-management terminology. It does not itself specify direct buying, managed service, an auction, or a fee schedule. Amazon campaign-management description.
The removal test: how to judge value without defending every fee
A participant creates economic value when its contribution exceeds its full cost relative to a feasible alternative. The relevant alternative might be another vendor, internal work, a platform’s integrated capability, or a simpler campaign.
The contribution can take several forms: access to buyers or audiences, better allocation decisions, lower operating effort, better delivery, stronger evidence, or assumption of commercial risk. Against those benefits, count explicit fees, hidden spreads, latency, integration work, errors, and conflicts of interest.
| Question | Evidence that earns a place in the chain | Warning sign |
|---|---|---|
| Does it add access? | Distinct buyers, inventory, or contractual rights | Another resale path to the same accessible supply |
| Does it improve decisions? | Better outcomes or publisher proceeds in a fair comparison | More targeting features without demonstrated improvement |
| Does it reduce work? | Reliable automation that replaces real effort | Complexity that mainly makes the vendor difficult to remove |
| Does it improve trust? | Reconciled records and independent quality evidence | The seller’s own success claims cannot be examined |
| Does it bear risk? | Enforceable delivery, payment, or performance obligations | A premium for risks passed entirely to someone else |
| Are incentives aligned? | Compensation tied to the customer’s objective | Rewards driven by spend, opacity, or favored supply |
This is where the chain can become inefficient. Too many resellers can duplicate access. Fragmented identity can produce repeated exposure. Different counting rules can frustrate settlement. Cheap impressions can reward low-quality inventory. Attribution can reward harvesting existing demand. Integrated platforms can make comparison difficult. Each problem requires a specific remedy; “remove the middlemen” is too coarse a diagnosis.
The engineering counterpart is to distinguish event types: request, bid, win, render, billable event, click, attributed conversion, invoice, and cash payment. If these become one undifferentiated “ad event,” both product decisions and accounting become unreliable. The economic truth depends on preserving which event happened, whose rule counted it, and which obligation it created.
For an investor or new employee, the final question is bargaining power: what does this company control that its customers cannot replace easily? A distinctive audience, a deep advertiser relationship, exclusive rights, reliable decision technology, or trusted evidence can each matter. A high fee may indicate valuable capability or market power; a low fee may accompany poor outcomes. The business must be understood at the level of its actual function and alternatives.
Where to go from here
When Maya encounters an advertisement, ask six questions: who funded it, who controlled the placement, who selected it, what triggered a charge, who received the money, and what evidence shows the result?
Then add the question that keeps the whole system honest: for every participant receiving money, what became better because it was there—and who would perform that job if it were gone?
The tours that follow will put this map in motion: a news-page auction, a direct reservation, a sponsored shopping result, a social feed, a game, a streaming break, a device screen, and an audio moment. The surfaces change. The discipline of tracing functions, money, rights, and evidence remains.
Names and scope
Company names follow the September 2026 source edition. Omnicom completed its acquisition of IPG in November 2025; GroupM became WPP Media in May 2025. The article therefore avoids counting those older names as additional independent agency groups. Omnicom announcement; WPP announcement; Publicis Media; dentsu.
This article covers the main commercial and decision-making roles. Consent management, browsers and operating systems, hosting, content delivery, video insertion, standards, and payment infrastructure also enable or constrain advertising; their costs often sit inside operating expenses or separate software contracts. A dependency is not automatically another percentage fee in the media payment chain.
Public fee disclosure remains incomplete. The linked product documentation, filings, and dated studies support their stated scope; unknown contract terms remain unknown.
Reference: impressions, clicks, views, and the billing meter
An ad unit is a configured placement: for example, a rectangle beside an article. An opportunity is a particular chance to fill it. An ad request asks for an ad; a bid request asks a buyer for an offer. An impression is an event counted under the applicable measurement rules. A viewable impression satisfies an additional visibility criterion. A click is an interaction. A conversion is a defined downstream action.
A page can contain several units, and scrolling can trigger additional requests through lazy loading. Refresh can create later opportunities under publisher and buyer policies. A single opportunity can also generate many bid requests through parallel selling paths. Those duplicates are not additional human attention. The important unit is the underlying opportunity, even when several systems describe it.
An auction win does not prove rendering, viewability, or billing. OpenRTB distinguishes a win notice, nurl, from a billing notice, burl; the latter follows the exchange's charging policy. Google Authorized Buyers likewise documents billable-impression tracking to avoid counting ads fetched in advance but never rendered. This is a more precise teaching rule than treating every win notification as universally billable. OpenRTB 2.6 Authorized Buyers implementation
A platform may report effective CPC or CPA even when it bills impressions. Likewise, a target CPA or target ROAS tells a bidder what to optimize; it does not automatically change the invoice event. Google's skippable-video documentation explicitly permits conversion-oriented bidding with impression billing. Video ad formats
Standard viewability is a minimum opportunity-to-see measure. The commonly cited desktop display baseline is at least 50% of pixels in view for one continuous second; video uses two continuous seconds. There are format exceptions and environment-specific rules, including a different pixel threshold for some large display units. A qualifying viewable impression is not proof that a person paid attention or remembered the brand. MRC viewability guidelines
Imagine a network charging Northstar $2 per click while buying a publisher's impressions for $6 CPM. If 1,000 impressions produce five billable clicks, advertiser billings are $10, media cost is $6, and $4 remains before the network's other costs. If only two clicks occur, billings are $4 against the same $6 media cost. This fictional example explains performance risk without assuming that buyer and publisher invoices match.
For comparable denominators, expected CPM from a CPC bid is approximately 1,000 × probability of a billable click × CPC. A $2 CPC bid and 0.5% predicted click probability imply $10 expected revenue per thousand opportunities, before other adjustments. This is an economic conversion, not a disclosed platform ranking formula. Quality, floors, eligibility, uncertainty, and policy can still determine the outcome.
The word effective is therefore consequential. Effective CPM, CPC, and CPA are ratios calculated from results; they do not establish how the original transaction was contracted.
Maya, Northstar Audio, City Ledger, and the assessment companies are fictional. Dollar examples are teaching scenarios unless explicitly labeled as disclosed rules or dated benchmarks. Provider illustrations show placement examples, not independently verified live campaigns. Product availability and terms vary by market; the main lens is the United States. Source links sit beside the claims they support.