Advertising Alloconomy, Part 14: Does the Allocation Create Economic Value?
Move from media receipts and attributed sales to incremental contribution, with the denominator and uncertainty kept visible.
Maya has encountered twelve kinds of advertising, but Northstar's finance team faces one recurring question: what did its spending buy, who earned revenue, and did the result justify the cost? The tours supply the transaction records. Interpreting those records requires a second level of judgment.
Compare the economic relationship before the percentage
The familiar $100 boundary makes the tours comparable without making their contracts identical. After the common illustrative $12 of external creative and $8 of campaign operations, the remaining $80 sometimes reaches one integrated seller, sometimes passes through separately priced services, and sometimes supports a disclosed creator share. The following distinctions determine what can be inferred from the picture.
| Relationship | What the tour establishes | What still needs another fact |
|---|---|---|
| Separate publisher and buying infrastructure | Different businesses can earn specified fees before publisher receipts | The applicable contract, fee bases, and whether charges overlap |
| Integrated owned-surface sale | A platform performs several functions and receives the media payment | Its internal costs, product margin, and any downstream obligations |
| Bundled offsite sale | A buyer pays for access involving a platform and outside media | The undisclosed division between those participants |
| Disclosed creator revenue share | A stated percentage applies to a defined revenue base | Whether the advertiser's invoice equals that base |
| Inventory sharing | Parties control stated portions of eligible opportunities | Prices, fill, rights, and proceeds from the opportunities each controls |
| Device distribution | A device makes the viewing experience accessible | Who owns the particular advertising right and sells this placement |
YouTube watch-page sharing, Shorts sharing, and Spotify's qualifying podcast sharing illustrate why percentages travel badly without their definitions. A percentage of defined net revenue, a percentage of an allocated creator pool, and a percentage of recognized qualifying revenue are different agreements. Roku's documented inventory-sharing arrangement illustrates another category: a share of eligible inventory does not establish the same share of campaign cash. These distinctions and their product-specific limits are developed in Part 9, 11, and 12.
A gray $80 endpoint means that the visible contract stops at a bundle whose internal allocation is unresolved. It is neither an $80 technology commission nor an $80 profit estimate. That uncertainty is useful information: it identifies the contract or disclosure needed next.
A fee needs both a rate and a base
A 20% deduction from a fixed $100 leaves $80 for the next recipient. A 20% markup on $100 of media produces a $120 invoice. If the total available is instead fixed at $100 under that markup agreement, media costs $83.33 and the fee is $16.67. “Twenty percent” cannot settle the invoice until the denominator and treatment are known.
Sequential fees also change bases. In Part 11's hypothetical programmatic route, the DSP receives 10% of the $80 execution budget, or $8. The seller-side charge is then 10% of the remaining $72, or $7.20. That second charge is 7.2% of the original $100 campaign expense. The two local 10% rates do not add to 20% of the original campaign budget.
Ask which services each amount includes. Verification, audience inputs, ad serving, or campaign operation may be separately charged, included in a bundle, or supplied internally. Removing a line from a diagram without establishing how its work is funded can make a reconciliation look better while leaving the real expense unchanged.
A high bid can have a low economic value
Consider two fictional offers for comparable opportunities. Offer A quotes $10 CPM but has a 10% probability of becoming billable; offer B quotes $5 CPM with a 50% probability. Their simplified expected values are $1 and $2.50 per thousand opportunities. The lower nominal bid can be more valuable. Google's published auction explanation uses expected billability as part of its account of offer comparison. Google's auction model
The distinction connects engineering to economics. A creative that fails to load, an ineligible event, or an offer that misses a deadline can prevent quoted value from becoming realized revenue. Bid price, expected value, clearing price, and settled publisher proceeds describe different stages. Even under a first-price rule, eligibility, fees, floors, deal terms, and selection upstream still matter.
Follow obligations into the financial statements
Request routing does not determine accounting presentation. A company can collect a large customer payment and owe much of it to suppliers while recognizing only its own net revenue. The Trade Desk reports gross client receivables and supplier payables while generally recognizing revenue net as an agent; its annual report explains why those balances can be large relative to revenue. The Trade Desk 2025 annual report
Amazon reported $68.635 billion of advertising-services revenue for 2025. That is a revenue category, not the merchandise value purchased after advertising. Its filing does not supply a complete public product-level revenue and profit split across Sponsored Products, display, DSP, streaming, and publisher services. Amazon 2025 annual report
The Trade Desk reported approximately $13.4 billion of gross spend and $2.896 billion of revenue for 2025. The derived ratio is about 21.6%. It is a revenue-to-spend ratio, not a universal contractual DSP fee. Service mix, data, pricing, and accounting affect the relationship. The Trade Desk FY2025 results The Trade Desk annual report
For a company comparison, label every figure: advertiser expense, gross spend handled, recognized revenue, seller receipts, or profit. Adding DSP throughput to SSP throughput and publisher revenue can count the same advertising dollar several times. A media owner's revenue and a buyer platform's gross spend are also different measures of economic activity.
Bring the advertiser's profit back into view
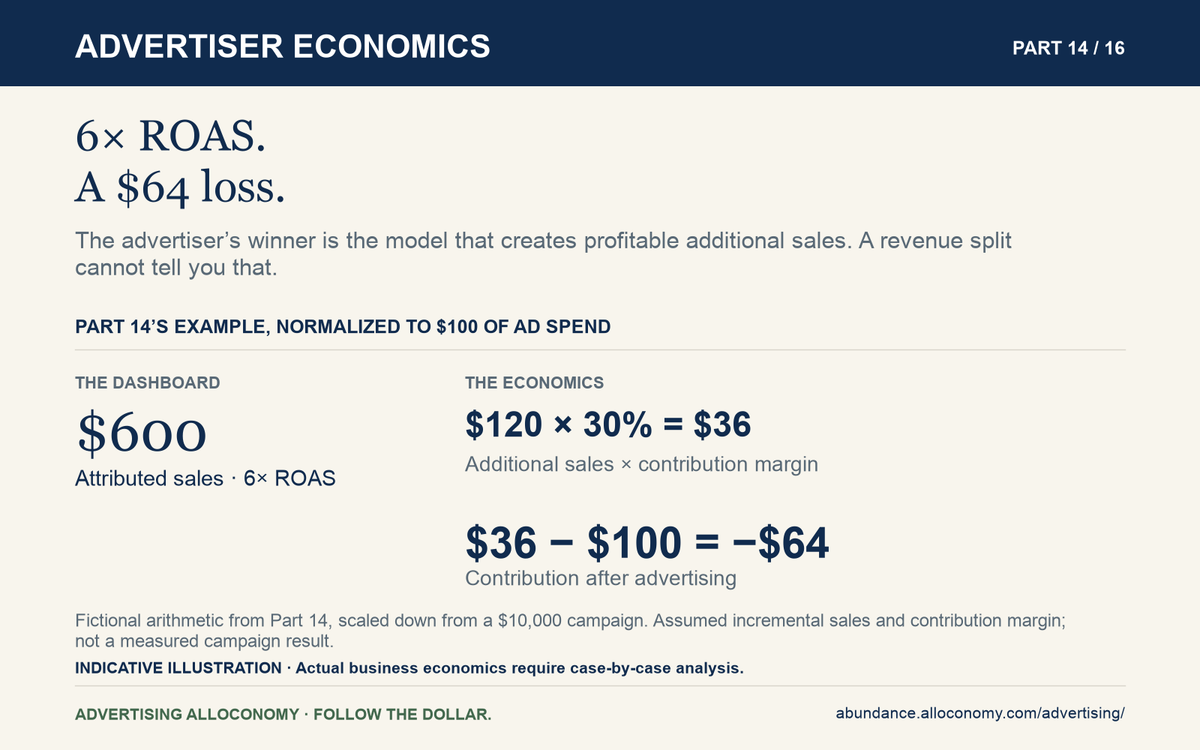
Suppose Northstar spends a fictional $10,000 and reports $60,000 of attributed sales: 6× ROAS. A defensible causal analysis estimates only $12,000 of incremental sales. At a 30% contribution margin before advertising, incremental contribution is $3,600. Subtract the campaign cost and incremental contribution after advertising is negative $6,400.
The example is a calculation, not a finding about a real campaign. It makes the missing inputs visible. Attribution assigns revenue credit; incrementality estimates sales caused; contribution margin translates those sales into resources available to fund advertising. A campaign can look efficient in a platform dashboard and still destroy advertiser value. The next chapter asks what evidence distinguishes those possibilities.
Did the advertisement work?
Maya sees a streaming commercial, clicks a search ad, returns directly, and buys Northstar headphones. Every system encountered along the way has a partial record. Before choosing which report to trust, identify the claim each record can support.
Climb the evidence ladder one step at a time
| Claim | Supporting evidence | What it does not establish |
|---|---|---|
| An opportunity existed | Request and placement records | An ad was delivered |
| An auction selected our ad | Selection records | A qualifying impression occurred |
| An ad was delivered and counted | Applicable rendering/playback and counting evidence | The person paid attention |
| An ad was viewable | Supported visibility measurement | The person remembered or wanted it |
| The user interacted | A valid click or other interaction | A profitable purchase followed |
| A sale was attributed | Matching plus a stated window and model | Advertising caused that sale |
| A sale was incremental | Credible counterfactual evidence | Incremental profit was positive |
This ladder combines protocol semantics, delivery documentation, measurement standards, and lift methods. Each step requires evidence that the previous step alone cannot provide. OpenRTB Impression counting MRC viewability Google Conversion Lift
An event name is not a universal guarantee. A win notification, a player-start event, a viewability event, and a conversion have distinct definitions. Useful reconciliation preserves those distinctions from collection through billing instead of treating every event as another spelling of “the ad worked.”
Attribution assigns credit under a rule
Several platforms may claim Maya's purchase under different lookback windows and models. Last-click attribution allocates credit to a qualifying click; view-through attribution associates an eligible exposure with a later conversion. Neither observes the world in which the advertising was absent.
Read the definitions before adding the totals: what counts as a purchase, the window, click-versus-view precedence, returns, cross-device matching, modeled conversions, and brand-halo purchases. Two platforms' attributed sales can overlap. Amazon Attribution, for example, measures supported non-Amazon marketing that drives Amazon outcomes; its public page describes a 14-day reporting window and distinguishes promoted-product and brand-halo reports. That definition must not be copied into every Amazon advertising product. Amazon Attribution
A clean room improves observation, not the counterfactual
Amazon Marketing Cloud accepts pseudonymized inputs and provides aggregated outputs for analysis, alongside supported audience capabilities. It can help examine reach overlap, paths, and campaign relationships. It does not provide an unrestricted list of named people. A joined exposure-and-purchase record is still an association until an appropriate design identifies an effect. Amazon Marketing Cloud
Google's Conversion Lift explanation compares a treatment group with a control group held back from the ads. With appropriate implementation, this supports estimation of incremental effects. The study still needs sufficient data, suitable timing, correct assignment and execution, and an assessment of uncertainty. Google Conversion Lift
Controlled experiments, geographic tests, and marketing-mix analysis can complement event-level attribution. They answer different questions with different limitations. Ask what decision the analysis supports, what was observed or modeled, and whether uncertainty is large enough to change that decision. Maya's memory of the first commercial, her later search, and her eventual purchase can all matter without any single event log proving the entire causal story.
What this changes for you: evidence and economic value
The practical payoff is the ability to challenge an impressive result without confusing a reporting rule with a business outcome.
If you are Maya
Keep credit claims in proportion.
Several platforms may associate Maya's one purchase with their ads. That does not turn it into several purchases or establish how much each message influenced her. Her own recollection is useful but also cannot prove the causal effect. She can remain curious about influence without treating a dashboard as a complete account of her decision.
If you work for the advertiser
Make the next budget depend on contribution.
Reconcile real orders and returns, identify overlapping attribution, and estimate incremental sales with suitable evidence and uncertainty. Translate those sales into contribution before subtracting the full campaign expense. The fictional 6× ROAS case shows why a strong headline ratio can coexist with negative incremental contribution.
If you work in a business earning the ad dollar
Sell evidence that can change a decision.
Measurement and analytics teams should state what their method observes, models, or estimates, and where it cannot distinguish cause from association. An agency can use that evidence to challenge its own preferred allocation. More attributed conversions or a more elaborate data join is not automatically better decision support.
If you are an investor
Keep the financial denominators consistent.
Separate advertiser expense, gross spend handled, recognized revenue, profit, and cash flow before comparing companies. Examine accounting policies and amounts owed onward. Adding every participant's throughput can count the same dollar repeatedly; comparing a net-revenue business with a gross-revenue business without adjustment can distort the story.
Decision to take away: write the budget decision with a range of plausible incremental outcomes, then identify what evidence could move the recommendation across its break-even point.
Maya, Northstar Audio, City Ledger, and the assessment companies are fictional. Dollar examples are teaching scenarios unless explicitly labeled as disclosed rules or dated benchmarks. Provider illustrations show placement examples, not independently verified live campaigns. Product availability and terms vary by market; the main lens is the United States. Source links sit beside the claims they support.