From Clay Tablets to OpenAI
An old, widely encountered problem offers ideas for deciding what modern accounting postings should retain.
Before we begin: this series assumes you understand what a chart of accounts is, why it remains useful in the age of AI, and the basics of dimensional modeling. For the accounting foundation, start with Why the Chart of Accounts Still Matters.
What would a chart of accounts look like inside Tesla, SpaceX or OpenAI?
The products are new. The design problem has a long history: deciding which distinctions to record when economic activity happens, so that other people can make sense of it later.
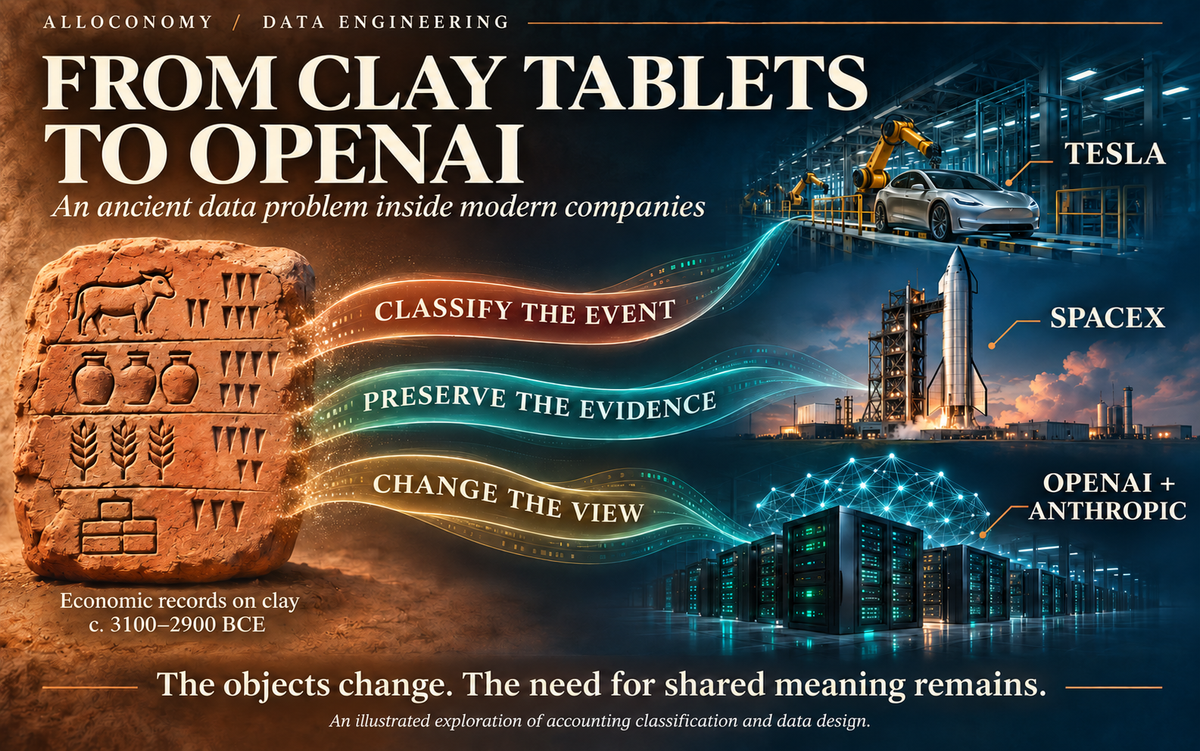
That is why I like starting with a clay tablet. The Metropolitan Museum of Art holds an administrative tablet from around 3100–2900 BCE that its curators interpret as a probable record of grain deliveries and distributions. Its marks distinguish quantities and kinds of goods. Someone had already faced a familiar problem: what information deserves a place in the record?
For me, the value of this connection is the invitation it offers. A problem this widespread, worked on for this long, is likely to have a rich stock of ideas worth learning from. Even a business built around reusable rockets or frontier AI models can look to earlier accounting practice for inspiration.
I want to explore one part of that inheritance: which attributes should become part of an accounting posting, and which should be retained elsewhere so that we can derive useful views later?
An old problem gives us somewhere to look
In 1494, Luca Pacioli explained bookkeeping methods already used by Venetian merchants. ICAEW’s history of early bookkeeping books traces that exposition and the later spread of the ideas. My takeaway is that a recording system becomes more useful when its conventions can be understood by someone beyond its original author.
The French Ministry of Economy’s history of the Plan comptable général records its approval in 1947 and progressive adoption. That raises another useful question: which classifications should be shared across organizations? I want to understand how common definitions were adapted to practical business needs.
Those examples give me two things to investigate when looking at a modern chart: how people made entries consistently interpretable, and how they balanced common categories with the needs of individual businesses. They are starting points for inquiry. The actual design still has to fit the business in front of us.
AI-assisted research makes this a particularly interesting time to learn. We can search accounting manuals, industry practices and ERP documentation for earlier treatments of a specific problem: project costing, responsibility centers, shared costs or changing organizational structures. I would ask for the original source, the problem it addressed and the conditions under which its solution worked. That is a more useful research brief than asking an agent to invent the perfect chart for an AI company.
First, what do we mean by an account?
“Chart of accounts” is used at different levels of detail. A natural account identifies an economic category, such as cash, trade payables or compute-services expense. In a segmented accounting system, the complete posting classification also includes dimensions such as company, cost center and project.
Here is a fictional posting combination:
Company A / Compute-services expense / Research / Project 17
The natural account is one component. Company, natural account, cost center and project are segments; “Research” is a segment value; the entire tuple is a posting combination. Some ERPs keep company in ledger context rather than in the account string. I will use “posting combination” for the complete set of controlled coordinates, wherever the product stores them. Microsoft’s account-structure documentation shows how rules combine a main account with financial dimensions to determine valid postings.
This distinction matters. A new project might require a new project value and some valid combinations with existing accounts. It need not create a new economic category.
One bill makes the choice concrete
Imagine an AI lab receives a compute bill. Finance needs to record the expense in the right company and cost center. Researchers want to know how much compute each model version consumed. Management wants to attribute the bill across those versions.
These requests concern the same bill, but they ask the data model to do different work.
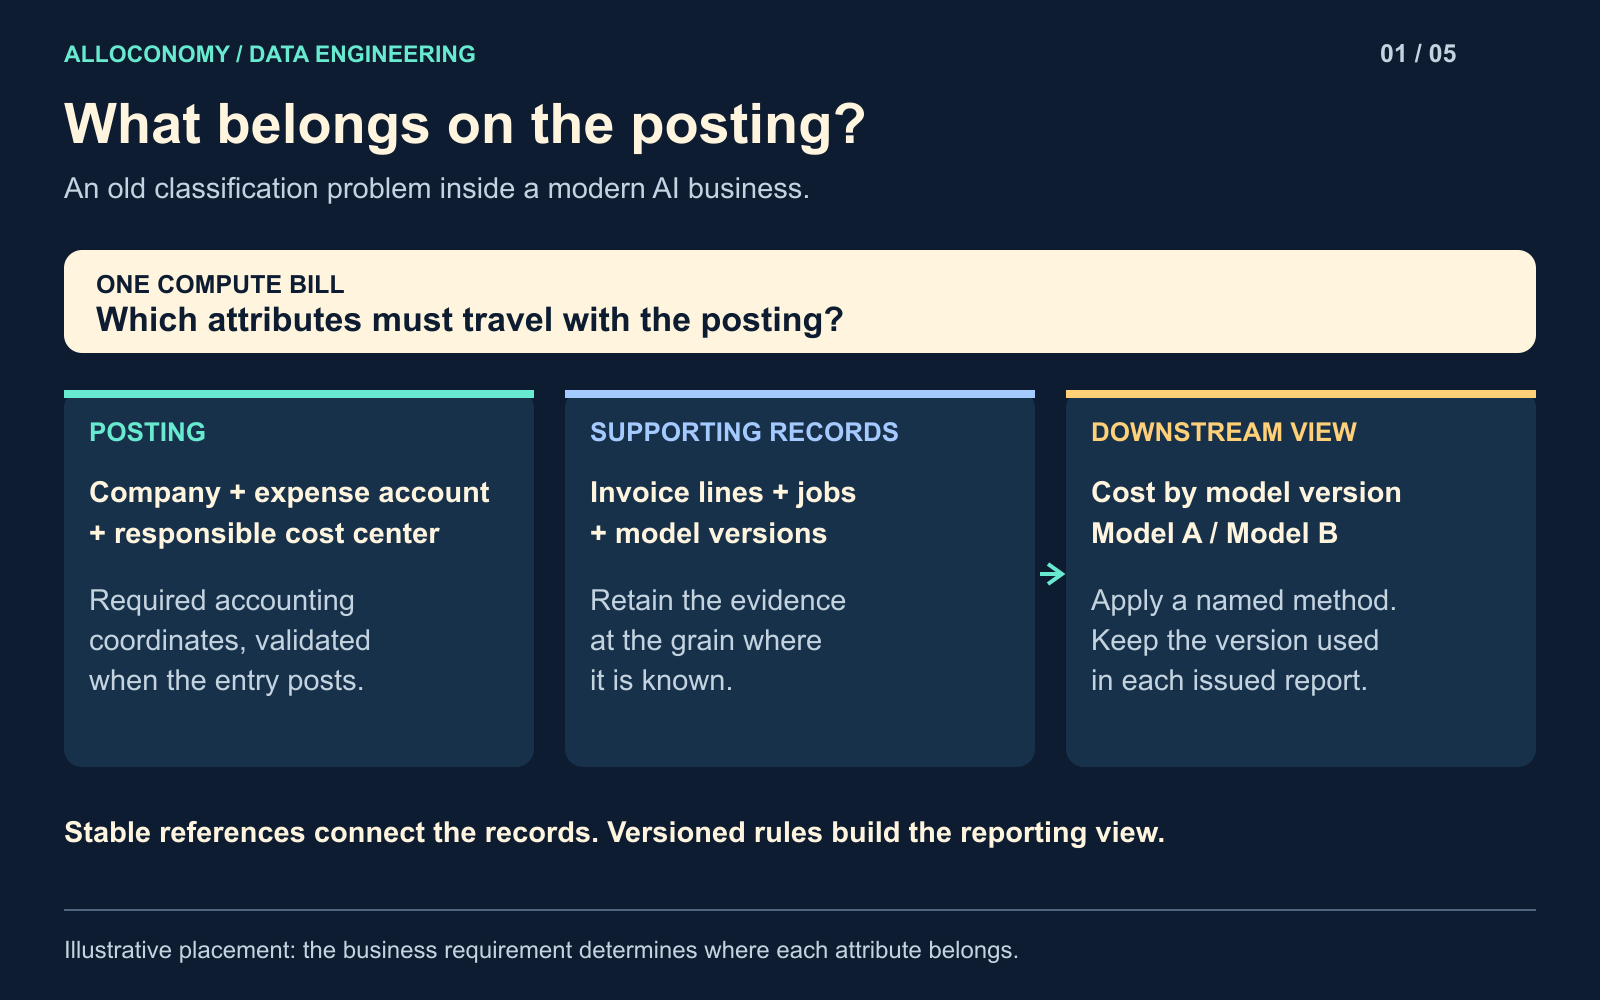
The company and responsible cost center may have to be established before the posting is accepted. Model versions can be retained with the jobs that consumed compute. A management allocation can then use those records to distribute shared charges across model versions.
That gives us three possible homes for an attribute:
| Home | What it does in this example |
|---|---|
| Posting combination | Records the company, expense category and responsible cost center required by the accounting workflow. |
| Supporting records | Retain invoice lines, jobs and model versions, connected to the expense. |
| Downstream view | Applies a named allocation method to report compute cost by model version. |
The difficult decision sits between those homes. If every model version becomes a chart segment, each release adds accounting configuration and combinations to maintain. If model versions are discarded from the supporting records, later analysis loses its evidence. If allocations are overwritten, last quarter’s report becomes difficult to explain.
Flexibility depends on what we keep
“Derive it downstream” is a useful answer only when the necessary evidence survives.
A reporting region can be derived from a retained city and a dated mapping. Cost by model can be estimated from retained usage and an explicit allocation method. Both require stored data. The choice is about where the attribute becomes authoritative and how its meaning can change.
For a data engineer, the consequential choice is which distinctions the business must settle when it posts an entry, and which interpretations it can reasonably revisit.
The next essay develops a decision method. We then try it on one question each from Uber, Tesla, SpaceX and the AI-provider business model shared by OpenAI and Anthropic. The fourth essay examines how those choices make accounting structures grow. The fifth asks whether an agent can explain what changed between two reports.
The old records make me curious about how much of this thinking we can borrow. The modern examples give us a way to test whether we have understood it.
Come, Learn with me!!