Who Pays for the Intelligence? A Guide to AI's Funding Landscape
Eight Alloconomy essays explain who funds AI infrastructure, what each participant expects in return, and who pays when the plan changes.
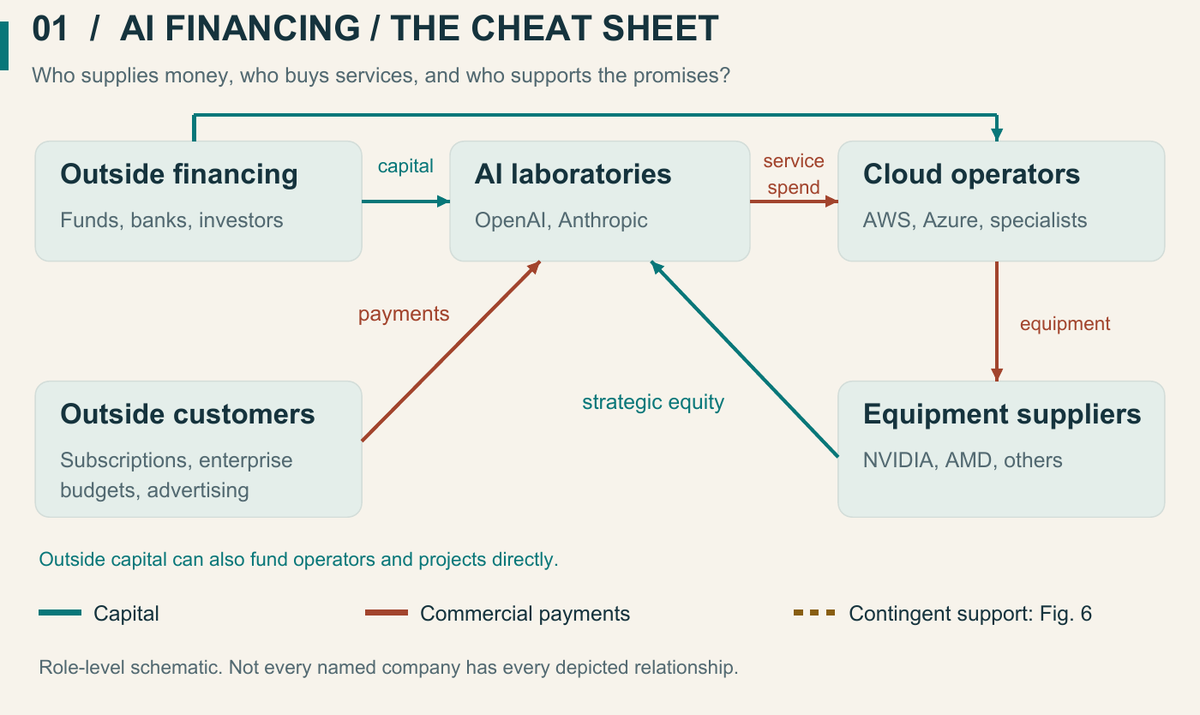
Who pays for the intelligence?
By the end of 2026, the world's AI building bill could reach $1.8 trillion accumulated since 2022, according to Goldman Sachs Research. Its estimate extends beyond US hyperscalers to private companies and firms abroad. It includes a forecast for the rest of 2026.
Now try a simple recovery scenario. Suppose the full $1.8 trillion still needs to be earned back at the start of 2027. Recovering it over 2027–2031 would take $360 billion left after costs each year. If 25 cents of every revenue dollar remained after operating costs, taxes and further investment, the businesses would need $1.44 trillion of annual revenue during those five future years.
Those are illustrative assumptions. The revenue figure is a hypothetical future requirement, not reported revenue or an earnings forecast. The scenario also excludes interest and the return investors would require beyond getting their money back.
Chips must be ordered, sites secured and construction financed before the customers who will use all that capacity have arrived. Who advances the money, through which agreements, and who carries the risk if the revenue arrives late? Follow the money through this series.

What about the industry's losses? The capital-investment estimate does not include all operating costs. The reviewed sources also do not establish matching, consolidated AI revenue for 2022–2026. Subtracting a few labs' sales from the global building bill would therefore produce a misleading “loss.” The financing question stands even without that number.
Meet the businesses that make the agreements easier to follow. Maya runs Stories Inc., a book publisher with its own printing business. Mayan runs Sapiens Inc., its printing-equipment supplier. Alongside Harbor Fund, Cedar Bank and MillHouse, they show how ownership, loans, leases, customer payments and guarantees move money—and leave different people responsible for different bills.
Investment dates, recovery assumptions and calculations
The investment period: 2022–2026. Goldman Sachs estimates global AI capital investment through end-2026. Its methods adjust for non-AI activity and extend beyond public US cloud companies. Attribution assumptions and potential lease overlap limit precision. The public article supplies a cumulative estimate, not a complete annual ledger; no annual breakdown has been invented here.
The hypothetical recovery period: 2027–2031. This is our five-year scenario, not a prediction by Goldman Sachs or Bain. We assume the full $1.8 trillion remains to be recovered on 1 January 2027. That is a simplifying assumption, not a measurement of the industry's outstanding losses or funding gap; the amount already recovered has not been established here. We also assume 25% of revenue remains after operating costs, taxes and further investment, before financing costs. This is an illustrative share left after costs, not an observed industry margin or a capex-to-revenue ratio. The five years are a teaching assumption, not a common repayment deadline or useful life for every asset.
The calculation. $1.8 trillion ÷ 5 years = $360 billion toward recovery per year. $360 billion ÷ 25% = $1.44 trillion of annual revenue. Across 2027–2031 that is $7.2 trillion of revenue, of which the assumed 25% leaves $1.8 trillion for recovery. No claim is made that this revenue was earned during 2022–2026 or will actually be earned later.
How the assumption changes the answer. Keeping the same five-year recovery period, leaving 10% after costs requires $3.6 trillion of annual revenue; leaving 20% requires $1.8 trillion; leaving 25% requires $1.44 trillion; leaving 30% requires $1.2 trillion. These are sensitivity examples, not a forecast range. A longer recovery period reduces the annual requirement if the other assumptions hold.
What this simple recovery scenario leaves out. This illustration recovers the initial amount without interest or an additional investor return, does not adjust future amounts for the time value of money, and assigns no value to assets remaining at the end. It does not establish economic profitability. A valuation would also need asset lives, replacement spending, financing costs, timing and a required return.
Counting the industry once. A lab's cloud payment is its supplier's revenue; a cloud company's chip purchase is the chip supplier's revenue. A combined industry account must reconcile these transactions. Funding rounds, valuations and commitments are not sales. Annualized revenue run rates are not revenue earned over a whole year.
All figures are in US dollars. One trillion is one thousand billion. Source and model review: 27 September 2026. The individual essays retain their own reporting dates.
The opening cheat sheet continues Money Cheat Sheets for Humans Working with AI. Keep it beside you while reading the deals, then close it and try explaining one relationship yourself.
Start with the cheat sheet
AI Financing: The Cheat Sheet — Start with a plain-English glossary, a linked twenty-concept lookup table and a flow diagram for every concept, grouped in the same order as the eight essays. Meet named people in concrete examples where they help, and read the actual arrangement directly where that is clearer. Definitions, calculations and links match the corresponding essay.
When AI Suppliers Finance Their Customers — Understand why a supplier may invest in the customer, buy its services or support its borrowing, and how those arrangements change the quality of demand.
Why Chipmakers Give Their Customers Equity — Decode customer warrants using Qualcomm, Marvell and AMD. Distinguish a right to buy shares from its value, its conditions and the cost to existing owners.
Follow the assets and the promises
Who Owns the AI Data Center? — Use Meta's Hyperion venture to separate the building owner, the tenant and the party supporting future value. A legal boundary does not answer every question about risk.
Can AI Revenue Be Real and Still Be Fragile? — Reconcile investment, service delivery and cash collection. A real sale can still depend on a customer raising more money.
Who Pays When an AI Promise Breaks? — Trace Google-backed arrangements, contractual limits and equipment collateral. A simple loss example shows why senior creditors can still lose money.
Put the pieces together
CoreWeave and the Four Clocks of AI Infrastructure — Connect construction, customer payments, debt deadlines and equipment life. A large backlog creates work to perform, not cash already earned.
What Could Break the AI Funding Cycle? — Replace a confident boom-or-bust forecast with a practical set of questions about delivery, customers, cash, credit and concentration.
The opening sets the scale and a hypothetical future recovery requirement. Parts 2–4 explain how suppliers and owners help finance the buildout; Parts 5–6 test the customer payments and promises behind it. Part 7 follows one company’s actual calendars, and Part 8 returns to who advances the money, what can earn it back and who carries a shortfall. The deal figures illustrate mechanisms; they are not amounts to add into a new industry total.
Keep four questions beside the next headline
- What kind of claim is this: investment, purchase, loan or guarantee?
- Has money moved, or has someone made a promise?
- What must happen before the asset earns cash?
- Who pays if that happens late?
The technology can be useful while some investments disappoint. A supplier can prosper while a customer struggles. A guarantee can reduce one lender's risk while concentrating exposure elsewhere. Understanding those distinctions makes the AI funding landscape easier to read without requiring either uncritical enthusiasm or a prediction of collapse.
About the evidence
The series uses primary company filings, original announcements, regulator materials and energy-system research checked through 26 September 2026. Each essay includes its own source notes. Financial reporting dates stay attached to the figures; company commitments are distinguished from completed delivery and cash received. Dollar amounts are US dollars unless stated otherwise.
The focus is a set of material relationships that explains how the system works. It is not a total of every AI financing worldwide, and it does not infer private contract terms that the public documents do not disclose.