Why Unit Economics? The Next Decision Needs More Than an Average
A profitable month can hide very different economics underneath. Connect the books to decisions about price, promises, processes, and capacity.
Who this is for. You know the P&L, balance sheet, cash flow statement, accounting equation, and the idea of double-entry bookkeeping. You do not need to be an accounting specialist. If those foundations need a refresh, start with James Hearle’s Accounting Stuff, then return.
Public sources and fictional examples. Company-specific facts come only from cited public materials. Every scenario, workflow, cutoff, rate, volume, allocation, and profitability amount is invented for teaching and must not be read as a description of any company’s internal practice. The interpretations are my own and do not represent my employer or any other organization. No confidential, proprietary, or nonpublic information is used.
The company made money. What should it do next?
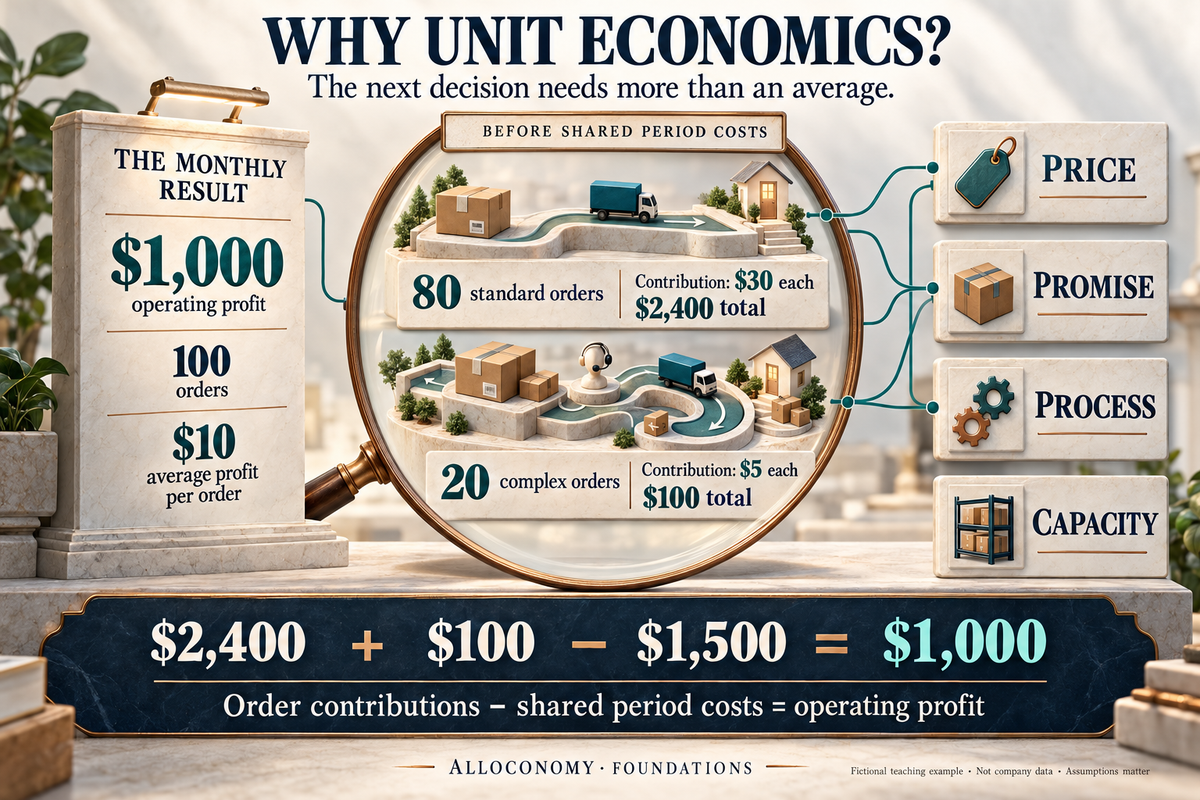
The books say the business made $1,000 of operating profit from 100 orders. That is $10 per order on average.
Tomorrow morning, someone must decide whether to offer faster delivery, fund a promotion, change a customer promise, or hire another service team.
What does the $10 tell them?
It tells them something real about the completed month. It does not yet tell them what those choices will change.
Unit economics connects the value a business earns to the resources needed to serve a meaningful unit of activity. Its purpose is to improve the next decision. That unit might be an order, ride, reservation, completed task, subscriber-day, or customer relationship over time. The useful boundary depends on the question.
A trustworthy company result and a useful decision view belong together. The following example shows why.
Two orders can bring the same revenue and create different work
Take a fictional retailer with 100 completed orders in one month. Each contributes $100 of net revenue and $60 of merchandise cost. Eighty orders follow a standard path. Twenty need more expensive fulfillment and service.
We assume the figures include the relevant return allowances and recoveries, all activity belongs to this month, and the following table captures all operating expenses in this simplified business. Financing and tax are outside the example. The group averages are teaching assumptions; real orders within each group would vary. Here, contribution means net revenue less the merchandise and order-linked costs shown, before shared period expenses.
| Per completed order, USD | Standard path | Complex path |
|---|---|---|
| Net revenue | 100 | 100 |
| Merchandise cost | −60 | −60 |
| Order-linked fulfillment and service costs | −10 | −35 |
| Contribution before shared period costs | 30 | 5 |
| Orders in the month | 80 | 20 |
| Total contribution | 2,400 | 100 |
The business also incurs $1,500 of shared period expenses, such as its management and common software costs. The bridge back to the P&L is simple:
$2,400 + $100 − $1,500 = $1,000 operating profit.
The $10 average is correct. The $30 and $5 contributions are also correct under the stated cost boundary. They answer different questions. Neither contribution is the order’s fully loaded net profit.
The detail exposes something the average concealed: the same sales revenue can arrive with very different demands on the business.
Four decisions make the work worthwhile
Keep four words in working memory: Price. Promise. Process. Capacity.
| Decision | What the unit view helps us ask |
|---|---|
| Price | Does the charge for a service cover the additional work it creates? What happens to demand if we change it? |
| Promise | Which delivery speed, service level, or return policy can we offer sustainably to this customer or order? |
| Process | Where do split shipments, errors, retries, or avoidable support contacts consume resources? What would removing that work change? |
| Capacity | Which people, vehicles, facilities, or computing resources should we expand, and what useful alternative would they otherwise serve? |
In our retailer, a blanket $8 promotion deserves different scrutiny on the two paths. Holding behavior and costs unchanged purely for illustration, it would reduce a standard order’s contribution from $30 to $22, and a complex order’s contribution from $5 to −$3. That calculation is a warning to investigate; it is not a complete promotion decision. Additional demand, repeat purchasing, capacity, and customer experience still matter.
An operations team might instead investigate why the complex path costs $25 more to serve. Better packaging or a clearer product description could prevent returns and support work while improving the customer’s experience. The useful outcome is a better service design, not merely a new label on the cost report.
A planning team needs to know whether growing that path requires another shift or facility. Costs that remain unchanged for one extra order can change materially when the business makes a larger commitment.
That is the practical connection to allocation: time, money, people, and capacity are finite. Unit economics helps us see what competing uses of those resources produce. Activity-based costing helps explain which work consumes them.
ERP is part of the answer
Enterprise resource planning, or ERP, connects business processes and records across areas such as finance, purchasing, inventory, and operations. Its scope extends well beyond the general ledger. Oracle’s ERP overview describes this integrated role.
It would be inaccurate to say ERP only produces monthly totals or cannot analyze profitability. SAP, for example, documents margin analysis by product and market segment, with cost and revenue information reconciled to the income statement. SAP Margin Analysis.
The practical question is whether the organization’s implemented systems contain the evidence and definitions needed for its particular decision, at the time it must make it.
A carrier bill may establish the total delivery expense. Operational records may explain which order had two shipments. A service system may show which promise generated a support case. Product and customer reference data may connect those records. Finance must determine recognition and cost treatment; a model may need to estimate what has happened but is not yet billed.
Those capabilities can live inside an ERP, in connected analytical systems, or across both. The architecture is a means to an end. The requirement is a useful economic view with a clear connection to the accounting records.
Reconciliation keeps the decision view accountable
Our example’s $2,500 of order contribution explains a part of the result. The $1,500 of shared costs explains the rest. Nothing disappears because it is inconvenient to allocate.
A real reconciliation may also need timing differences, unassigned costs, different currencies, or different business scope. Those differences should be identified and explained. A daily estimate need not equal a closed monthly result before the periods, scope, and evidence are aligned.
Agreement in total is necessary for a reconciled view, but it is not proof that every unit is correct. Moving $400 of fulfillment cost from one group to the other can leave company profit unchanged while changing the apparent attractiveness of the two paths.
We therefore need both questions: Does the total reconcile? Does the attribution make sense?
This is where finance and engineering have a shared problem. The definition of the unit, the source evidence, and the rules connecting them must remain inspectable. An unexplained remainder is a reason to investigate, not an invitation to spread the difference until the chart looks tidy.
A fully allocated loss is not automatically a reason to stop
Suppose we spread the $1,500 of shared expenses evenly across the 100 orders: $15 per order. The standard path now shows $15 after allocation. The complex path shows −$10.
Should we stop serving the complex path?
For a deliberately narrow next-month scenario, assume the 80 standard orders remain, all $95 of cost attached to each complex order would be avoided, the $1,500 shared expense would remain, and freed capacity has no alternative use. Removing the 20 complex orders would remove their $100 of contribution. Operating profit would fall from $1,000 to $900.
The allocated loss did not mean that rejecting those orders would save the allocated overhead.
Relevant-cost analysis asks which future cash flows change because of the decision, including additional fixed commitments and benefits forgone when capacity has another use. Reapportioning an unchanged cost does not create a saving. ACCA’s explanation of relevant costs.
The reverse mistake is also possible: accepting thin contributions indefinitely without funding the shared resources required to sustain the business. A longer-term decision needs capacity investment, working capital, risk, and the durability of customer demand. Contribution is not free cash flow.
The aim is to keep cost layers visible and choose the layer and time horizon appropriate to the decision.
The unit must follow the relationship we are trying to understand
For a delivery redesign, the useful lens may be a shipment or order. For acquiring a subscriber, it may be a cohort followed over months, including acquisition spending, cancellations, and future service costs. A viewing event can explain resource consumption without being a separately sold subscription.
That is why there is no universal “profit per event.” A customer relationship can create many events, several services, and costs that arrive later. Choosing the wrong denominator can make a precise calculation answer the wrong question.
Nor should a historical average become an automatic instruction to a pricing or routing system. A future action needs an estimate of what will change, tested against observed outcomes and the business’s service commitments. Repeating a weak assumption quickly only spreads its consequences.
A team can start with the decision that matters, the evidence needed to improve it, and a level of detail worth its cost. Not every business needs to calculate a new margin for every event.
Why this leads to a daily unit-level close
The purpose comes first: help people make better choices about what to charge, what to promise, how to work, and where to invest capacity.
Then comes the difficult requirement. If those choices are made every day, the economic evidence must be timely enough to help. It must include supported estimates for missing costs, retain later revisions, and remain connected to the books. A fast dashboard with an incomplete cost boundary can confidently encourage the wrong growth.
Month-End Close explains the accounting discipline behind a trustworthy period result. The next series asks what happens when we carry that discipline down to daily units, across a large and changing population.
Continue with Unit Economics: The Discipline of Close, Every Day, Every Unit. It introduces five recurring challenges—unit, timing, missing amounts, shared costs, and revisions—then works through fictional examples inspired by Uber, Airbnb, Walmart, Taskrabbit, and Netflix.
Knowing why we need the number gives us a reason to do the hard work of making it trustworthy.
© 2026 Alloconomy LLC. All rights reserved.